!pip install -q pystac-client planetary-computerSTAC to GeoCroissant Time-Series Converter

Converts STAC items from Microsoft Planetary Computer to GeoCroissant format with proper time-series support.
Workflow
- Install dependencies
- Define data fetching functions
- Define GeoCroissant conversion functions
- Generate GeoCroissant JSON with fresh URLs
- Validate the GeoCroissant JSON
- Visualize RGB composite from GeoCroissant metadata
Step 1: Install Dependencies
Install required Python packages: - pystac-client: For searching and accessing STAC catalogs - planetary-computer: For signing Microsoft Planetary Computer URLs
Step 2: Define Data Fetching Function
Define a function to fetch STAC items from Microsoft Planetary Computer. This function: - Searches for satellite imagery based on collection ID, bounding box, and time range - Groups items by month and selects one representative item per month - Returns a time-series of monthly observations
import pystac_client
import planetary_computer
from collections import defaultdict
from datetime import datetime
import json
import sys


def fetch_monthly_items(collection, bbox, time_range):
    """Fetch one STAC item per month for a given spatial and temporal extent.

    Args:
        collection: STAC collection ID
        bbox: Bounding box [min_lon, min_lat, max_lon, max_lat]
        time_range: Date range in format "YYYY-MM-DD/YYYY-MM-DD"

    Returns:
        List of STAC items (one per month)
    """
    catalog = pystac_client.Client.open(
        "https://planetarycomputer.microsoft.com/api/stac/v1",
        modifier=planetary_computer.sign_inplace,
    )

    search = catalog.search(
        collections=[collection],
        bbox=bbox,
        datetime=time_range,
    )

    items = list(search.get_items())

    # Group by month
    monthly_items = defaultdict(list)
    for item in items:
        item_date = datetime.fromisoformat(item.datetime.isoformat())
        year_month = item_date.strftime("%Y-%m")
        monthly_items[year_month].append(item)

    # Select first item from each month
    selected_items = []
    for month in sorted(monthly_items.keys()):
        if monthly_items[month]:
            selected_items.append(monthly_items[month][0])

    return selected_items
Step 3: Define GeoCroissant Conversion Functions
Define functions to convert STAC items to GeoCroissant format:
def convert_items_to_geocroissant(items_list):
    """Convert list of STAC items to Geocroissant Dataset format with proper structure.

    Key principles:
    - Band configuration and spectral metadata defined ONCE at dataset level
    - Distribution contains FileSet entries for monthly spectral band TIFFs
    - RecordSet examples show only 2 sample records (not all data!)
    - geocr:timeSeriesIndex indicates temporal ordering

    Args:
        items_list: List of STAC item dictionaries with full metadata.

    Returns:
        Dictionary with Geocroissant structure conforming to croissant.ttl and geocr.ttl.
    """

    if not items_list:
        return {}

    # Calculate temporal and spatial extents
    min_date = None
    max_date = None
    min_lon = float('inf')
    min_lat = float('inf')
    max_lon = float('-inf')
    max_lat = float('-inf')

    for item in items_list:
        dt_str = item.get('properties', {}).get('datetime')
        if dt_str:
            dt = datetime.fromisoformat(dt_str.replace('Z', '+00:00'))
            if min_date is None or dt < min_date:
                min_date = dt
            if max_date is None or dt > max_date:
                max_date = dt

        bbox = item.get('bbox', [])
        if bbox and len(bbox) >= 4:
            min_lon = min(min_lon, bbox[0])
            min_lat = min(min_lat, bbox[1])
            max_lon = max(max_lon, bbox[2])
            max_lat = max(max_lat, bbox[3])

    # Extract spectral bands from first item - DEFINED ONCE for entire dataset
    first_item = items_list[0]
    spectral_bands = []
    band_names = []

    for asset_key, asset in first_item.get('assets', {}).items():
        if 'B' in asset_key or 'B8A' in asset_key:
            band_names.append(asset_key)
            eo_bands = asset.get('eo:bands', [])
            if eo_bands:
                spectral_band_entry = {
                    "@type": "geocr:SpectralBand",
                    "name": eo_bands[0].get('common_name', asset_key),
                    "geocr:centerWavelength": {
                        "@type": "QuantitativeValue",
                        "value": eo_bands[0].get('center_wavelength'),
                        "unitText": "nm"
                    }
                }
                if eo_bands[0].get('full_width_half_max'):
                    spectral_band_entry["geocr:bandwidth"] = {
                        "@type": "QuantitativeValue",
                        "value": eo_bands[0].get('full_width_half_max'),
                        "unitText": "nm"
                    }
                spectral_bands.append(spectral_band_entry)

    first_props = first_item.get('properties', {})
    proj_code = first_props.get('proj:code', 'EPSG:4326')

    # Build Geocroissant structure
    geocr_dataset = {
        "@context": {
            "@language": "en",
            "@vocab": "https://schema.org/",
            "cr": "http://mlcommons.org/croissant/",
            "geocr": "http://mlcommons.org/croissant/geo/",
            "dct": "http://purl.org/dc/terms/",
            "sc": "https://schema.org/",
            "citeAs": "cr:citeAs",
            "column": "cr:column",
            "conformsTo": "dct:conformsTo",
            "data": {"@id": "cr:data", "@type": "@json"},
            "examples": {"@id": "cr:examples", "@type": "@json"},
            "dataBiases": "cr:dataBiases",
            "dataCollection": "cr:dataCollection",
            "dataType": {"@id": "cr:dataType", "@type": "@vocab"},
            "extract": "cr:extract",
            "field": "cr:field",
            "fileObject": "cr:fileObject",
            "fileProperty": "cr:fileProperty",
            "fileSet": "cr:fileSet",
            "format": "cr:format",
            "includes": "cr:includes",
            "isLiveDataset": "cr:isLiveDataset",
            "jsonPath": "cr:jsonPath",
            "key": "cr:key",
            "md5": "cr:md5",
            "parentField": "cr:parentField",
            "path": "cr:path",
            "personalSensitiveInformation": "cr:personalSensitiveInformation",
            "recordSet": "cr:recordSet",
            "references": "cr:references",
            "regex": "cr:regex",
            "repeated": "cr:repeated",
            "replace": "cr:replace",
            "samplingRate": "cr:samplingRate",
            "separator": "cr:separator",
            "source": "cr:source",
            "subField": "cr:subField",
            "transform": "cr:transform",
            "equivalentProperty": "cr:equivalentProperty",
            "rai": "http://mlcommons.org/croissant/RAI/"
        },
        "@type": "sc:Dataset",
        "name": "HLS_Sentinel2_TimeSeries_Jan_Dec_2025",
        "description": f"Sentinel-2B HLS time series with {len(items_list)} monthly observations. IMPORTANT: Band configuration ({len(band_names)} bands) and spectral metadata are defined ONCE at dataset level and inherited by ALL monthly observations. Individual monthly granules with their TIFF file URLs listed in distribution.",
        "conformsTo": "http://mlcommons.org/croissant/1.0",
        "version": "1.0.0",
        "alternateName": "HLS Sentinel-2 Monthly Time Series",
        "creator": {
            "@type": "Organization",
            "name": "Microsoft Planetary Computer",
            "url": "https://planetarycomputer.microsoft.com"
        },
        "keywords": [
            "satellite imagery",
            "Sentinel-2",
            "HLS",
            "multispectral",
            "time series",
            "earth observation",
            "remote sensing"
        ],
        "cr:citeAs": "Microsoft Planetary Computer HLS Sentinel-2B Collection",
        "datePublished": min_date.isoformat() if min_date else datetime.utcnow().isoformat(),
        "license": "https://creativecommons.org/licenses/by/4.0/",

        "spatialCoverage": {
            "@type": "Place",
            "geo": {
                "@type": "GeoShape",
                "box": f"{min_lat} {min_lon} {max_lat} {max_lon}"
            }
        },
        "temporalCoverage": f"{min_date.isoformat()}/{max_date.isoformat()}" if min_date and max_date else None,

        # GeoCroissant properties - DEFINED ONCE
        "geocr:spatialResolution": {
            "@type": "QuantitativeValue",
            "value": 30.0,
            "unitText": "m"
        },
        "geocr:coordinateReferenceSystem": proj_code,
        "geocr:temporalResolution": {
            "@type": "QuantitativeValue",
            "value": 1,
            "unitText": "month"
        },

        # Band configuration - DEFINED ONCE, applies to ALL monthly observations
        "geocr:bandConfiguration": {
            "@type": "geocr:BandConfiguration",
            "geocr:totalBands": len(band_names),
            "geocr:bandNameList": band_names
        },

        # Spectral metadata - DEFINED ONCE, applies to ALL monthly observations
        "geocr:spectralBandMetadata": spectral_bands,

        # Distribution: FileSet for each monthly granule
        "distribution": []
    }

    # Create FileSet entries for each month's spectral bands
    for idx, item in enumerate(items_list, 1):
        item_id = item.get('id', f'item_{idx}')
        dt_str = item.get('properties', {}).get('datetime', '')

        # Get first band asset URL to extract base path
        assets = item.get('assets', {})
        if band_names and band_names[0] in assets:
            first_band_url = assets[band_names[0]].get('href', '')
            # Extract base URL (remove band-specific part)
            # URL format: https://.../HLS.S30.T11SMT.2025027T183539.v2.0/HLS.S30.T11SMT.2025027T183539.v2.0.B01.tif
            if '.B' in first_band_url:
                base_url = first_band_url.rsplit('.B', 1)[0]  # Get path without .BXX.tif
            else:
                base_url = first_band_url.rsplit('/', 1)[0]  # Get directory
        else:
            base_url = ""

        # Create FileSet with pattern matching for all band TIFFs
        file_set = {
            "@type": "cr:FileSet",
            "@id": f"granule_{idx}_bands",
            "name": f"{item_id}_spectral_bands",
            "description": f"13 spectral band GeoTIFF files for {item_id} ({dt_str})",
            "contentUrl": base_url,
            "encodingFormat": "image/tiff",
            "includes": "*.tif"
        }
        geocr_dataset['distribution'].append(file_set)

    # RecordSet with geocr:timeSeriesIndex
    time_series_recordset = {
        "@type": "cr:RecordSet",
        "@id": "time_series_observations",
        "name": "time_series_observations",
        "description": f"Time-series with {len(items_list)} monthly observations. Each record has 13 spectral bands as defined in dataset-level geocr:bandConfiguration.",

        # KEY for time-series: indicates temporal ordering field
        "geocr:timeSeriesIndex": "observation_datetime",

        "field": [
            {
                "@type": "cr:Field",
                "@id": "time_series_observations/granule_id",
                "name": "granule_id",
                "description": "Unique identifier for monthly observation",
                "dataType": "sc:Text",
                "source": {
                    "fileSet": "granule_1_bands",  # Reference first granule as example
                    "extract": {
                        "column": "granule_id"
                    }
                }
            },
            {
                "@type": "cr:Field",
                "@id": "time_series_observations/observation_datetime",
                "name": "observation_datetime",
                "description": "Observation timestamp (ISO 8601)",
                "dataType": "sc:DateTime",
                "source": {
                    "fileSet": "granule_1_bands",
                    "extract": {
                        "column": "observation_datetime"
                    }
                }
            },
            {
                "@type": "cr:Field",
                "@id": "time_series_observations/month",
                "name": "month",
                "description": "Year-month (YYYY-MM)",
                "dataType": "sc:Text",
                "source": {
                    "fileSet": "granule_1_bands",
                    "extract": {
                        "column": "month"
                    }
                }
            },
            {
                "@type": "cr:Field",
                "@id": "time_series_observations/platform",
                "name": "platform",
                "description": "Satellite platform",
                "dataType": "sc:Text",
                "source": {
                    "fileSet": "granule_1_bands",
                    "extract": {
                        "column": "platform"
                    }
                }
            },
            {
                "@type": "cr:Field",
                "@id": "time_series_observations/cloud_cover",
                "name": "cloud_cover",
                "description": "Cloud cover percentage",
                "dataType": "sc:Float",
                "source": {
                    "fileSet": "granule_1_bands",
                    "extract": {
                        "column": "cloud_cover"
                    }
                }
            }
        ],

        # Examples: Only 2 sample records to illustrate structure
        "examples": []
    }

    # Add only 2 example records (NOT all months!)
    for idx, item in enumerate(items_list[:2], 1):
        item_props = item.get('properties', {})
        item_id = item.get('id', f'item_{idx}')
        dt_str = item_props.get('datetime', '')
        dt_obj = datetime.fromisoformat(dt_str.replace('Z', '+00:00'))

        example = {
            "granule_id": item_id,
            "observation_datetime": dt_str,
            "month": dt_obj.strftime("%Y-%m"),
            "platform": item_props.get('platform', 'sentinel-2b'),
            "cloud_cover": item_props.get('eo:cloud_cover', 0)
        }
        time_series_recordset['examples'].append(example)

    geocr_dataset['recordSet'] = [time_series_recordset]

    return geocr_dataset

def save_geocroissant(dataset, filename):
    """Save GeoCroissant dataset to JSON file.

    Args:
        dataset: GeoCroissant dataset dictionary
        filename: Output file path
    """
    with open(filename, 'w') as f:
        json.dump(dataset, f, indent=2)
Step 4: Generate GeoCroissant JSON
Fetch STAC items for the specified area and time range, then convert to GeoCroissant format: - Collection: HLS Sentinel-2 (hls2-s30) - Location: Orange County, California area - Time range: January - December 2025
# Run this cell to generate GeoCroissant JSON with fresh URLs
collection = "hls2-s30"
bbox = [-117.8, 33.65, -117.65, 33.8]
time_range = "2025-01-01/2025-12-31"
output_file = "geocr-timeseries.json"

selected_items = fetch_monthly_items(collection, bbox, time_range)
items_as_dicts = [item.to_dict() for item in selected_items]
geocr_dataset = convert_items_to_geocroissant(items_as_dicts)
save_geocroissant(geocr_dataset, output_file)
Step 5: Validate GeoCroissant JSON
Validate the generated GeoCroissant JSON file using the MLCroissant validator to ensure it conforms to the Croissant schema.
!mlcroissant validate --jsonld=geocr-timeseries.jsonI0216 20:47:44.756744 131376160249344 validate.py:53] Done.Step 6: Visualize Time Series from GeoCroissant
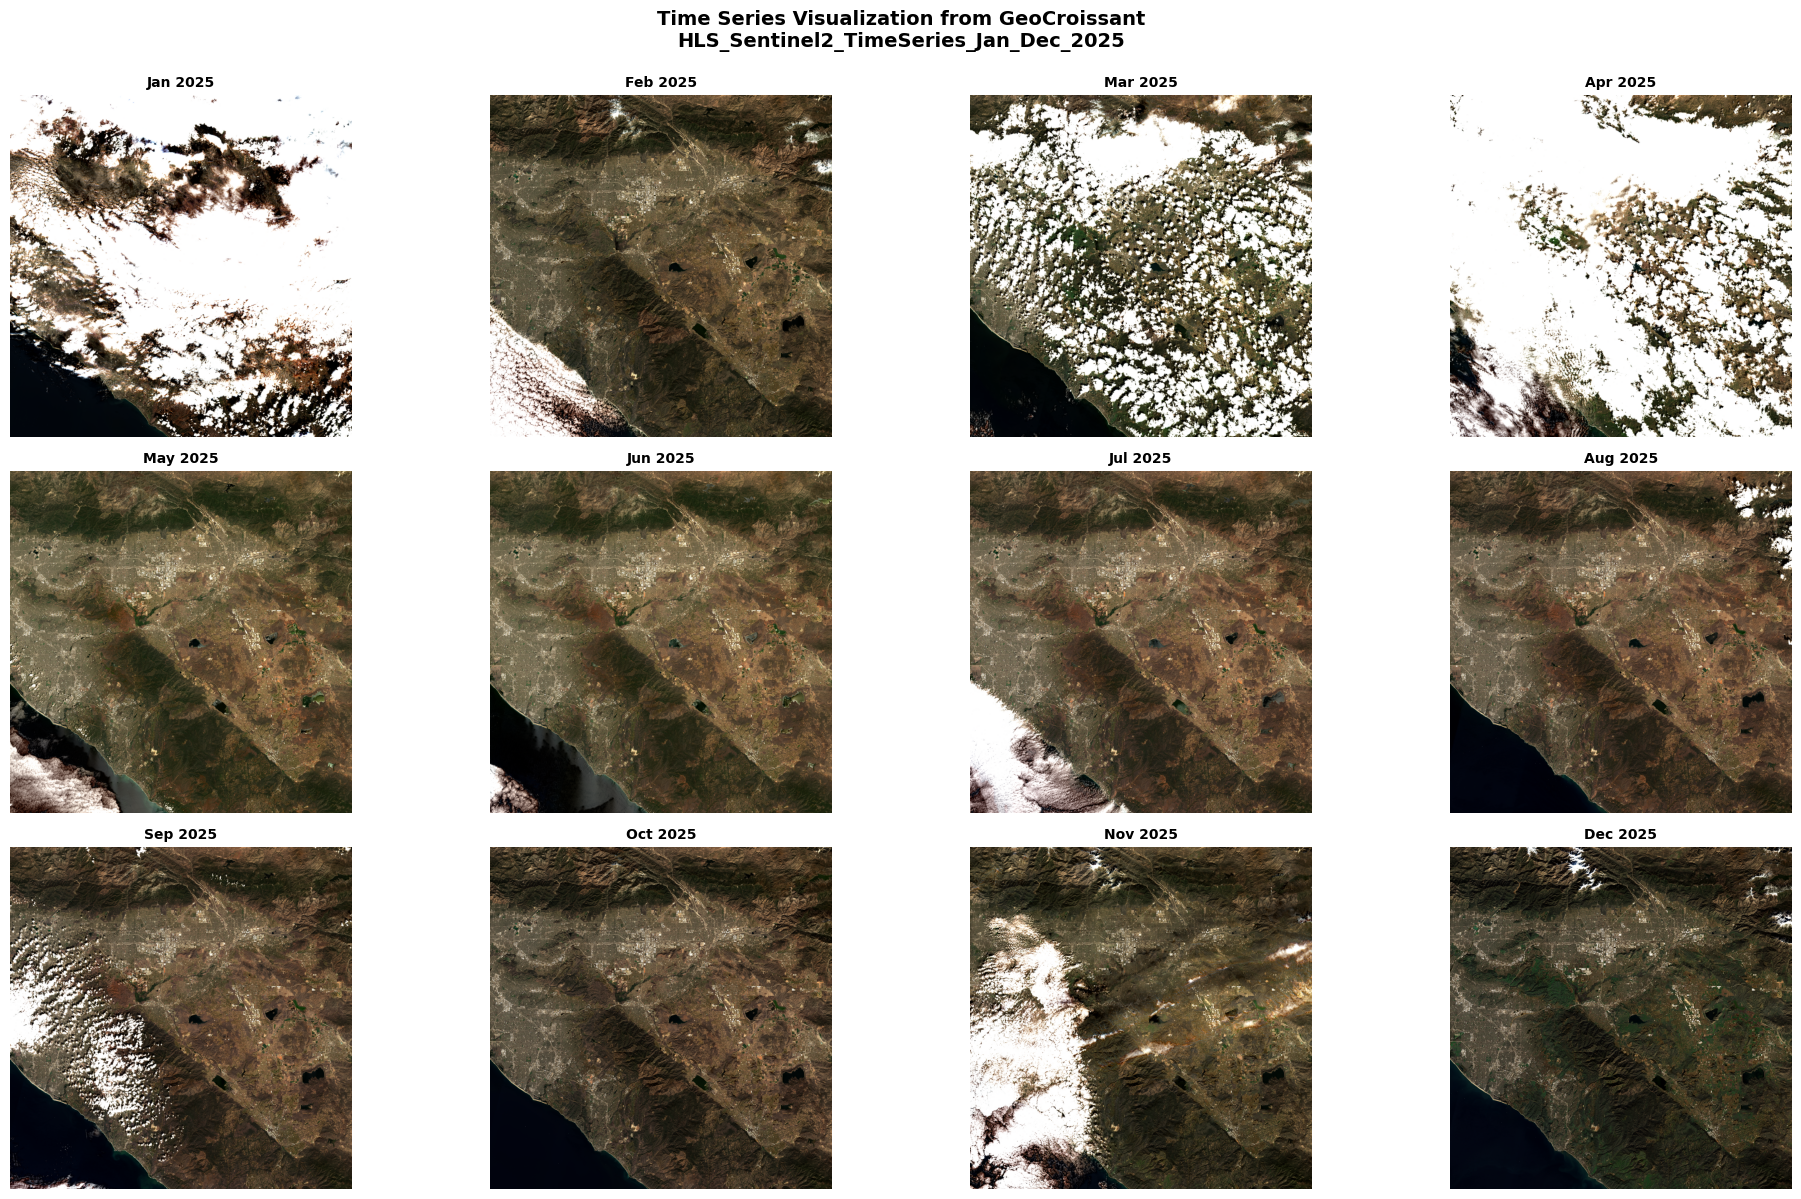
Load the GeoCroissant JSON and visualize all monthly observations: - Reads the GeoCroissant metadata to get URLs for each month’s data - Constructs RGB composites from bands B04 (red), B03 (green), B02 (blue) - Displays all months in a grid layout showing temporal changes
This demonstrates how GeoCroissant metadata enables direct data access and visualization.
import numpy as np
import matplotlib.pyplot as plt
import rasterio
import json
import planetary_computer
from datetime import datetime

# Load GeoCroissant JSON
with open('geocr-timeseries.json', 'r') as f:
    geocr_data = json.load(f)

# Get all FileSets from distribution (all monthly observations)
all_filesets = geocr_data['distribution']
num_months = len(all_filesets)

# Calculate grid layout (e.g., 3 or 4 columns)
cols = 4 if num_months > 6 else 3
rows = (num_months + cols - 1) // cols

# Create figure with subplots
fig, axes = plt.subplots(rows, cols, figsize=(5*cols, 4*rows))
axes = axes.flatten() if num_months > 1 else [axes]

# Process each monthly granule
for idx, fileset in enumerate(all_filesets):
    base_url = fileset['contentUrl']
    granule_name = fileset['name']

    # Extract date from granule name or description
    granule_desc = fileset.get('description', '')

    # Construct URLs for RGB bands (B04=red, B03=green, B02=blue)
    red_url = f"{base_url}.B04.tif"
    green_url = f"{base_url}.B03.tif"
    blue_url = f"{base_url}.B02.tif"

    # Sign URLs with Planetary Computer
    red_url_signed = planetary_computer.sign(red_url)
    green_url_signed = planetary_computer.sign(green_url)
    blue_url_signed = planetary_computer.sign(blue_url)

    try:
        # Read RGB bands
        with rasterio.open(red_url_signed) as src:
            red = src.read(1)

        with rasterio.open(green_url_signed) as src:
            green = src.read(1)

        with rasterio.open(blue_url_signed) as src:
            blue = src.read(1)

        # Stack and normalize
        rgb = np.dstack((red, green, blue))
        rgb = np.clip(rgb / 3000.0, 0, 1)

        # Display in subplot
        axes[idx].imshow(rgb)

        # Extract month from description (format: "...for ITEM_ID (YYYY-MM-DDTHH:MM:SS...)")
        if '(' in granule_desc and ')' in granule_desc:
            date_str = granule_desc.split('(')[1].split(')')[0]
            try:
                date_obj = datetime.fromisoformat(date_str.replace('Z', '+00:00'))
                month_label = date_obj.strftime("%b %Y")
            except:
                month_label = f"Month {idx+1}"
        else:
            month_label = f"Month {idx+1}"

        axes[idx].set_title(month_label, fontsize=10, fontweight='bold')
        axes[idx].axis('off')

    except Exception as e:
        axes[idx].text(0.5, 0.5, f'Error loading\n{month_label}',
                      ha='center', va='center', transform=axes[idx].transAxes)
        axes[idx].axis('off')

# Hide extra subplots if grid is larger than number of months
for idx in range(num_months, len(axes)):
    axes[idx].axis('off')

plt.suptitle(f'Time Series Visualization from GeoCroissant\n{geocr_data["name"]}',
             fontsize=14, fontweight='bold', y=0.995)
plt.tight_layout()
plt.show()